Data report
Leaving Quebec: 55 years of interprovincial migration, by the numbers (1971–2026)
The short answer
Quebec has lost residents to the rest of Canada every year since 1971: 55 negative years out of 55, the only province with that record. The cumulative balance is −659,156 people, the largest absolute loss in the country. Measured against its population, though, the loss is modest (−0.74 per 1,000 a year over the last decade), and since 2020 Ontario has lost more. Quebec’s real distinguishing trait: very few people move in or out.
Key numbers
- 55 out of 55: the years (1971/72 to 2025/26) in which Quebec lost more residents to other provinces than it gained. No other province has that record.
- −659,156: the cumulative balance since 1971 (1,986,535 departures, 1,327,379 arrivals).
- −46,429: the worst year, 1977/78, when the Charter of the French Language (Bill 101) was adopted.
- −7,084: the 2025/26 balance, or −0.78 per 1,000 residents. Ontario did worse (−18,015, −1.11 per 1,000).
- 2.8 per 1,000: Quebec’s yearly rate of arrivals from other provinces over the last 10 years, the lowest in Canada (Alberta: 14.7).
- 59%: the share of people leaving Quebec who go to Ontario (2025/26).
- 68%: the share of the last decade’s net loss made up of people aged 20 to 44.
55 years of losses, without exception
Interprovincial migration means people who change their province of residence within Canada. Statistics Canada estimates it every year, from July 1 to June 30, mostly from the addresses on tax returns and Canada Child Benefit records [1]. The balance is simple: arrivals minus departures.
For Quebec, that balance has been negative in each of the 55 published years, from 1971/72 to 2025/26. In all, 1,986,535 people left for another province or territory and 1,327,379 arrived, a net loss of 659,156 people [1]. That is about 7% of Quebec’s current population (9,067,114 on July 1, 2026) [2]. No other province has 55 negative years: even Manitoba, which almost always loses, had two positive years (1982/83 and 1983/84).
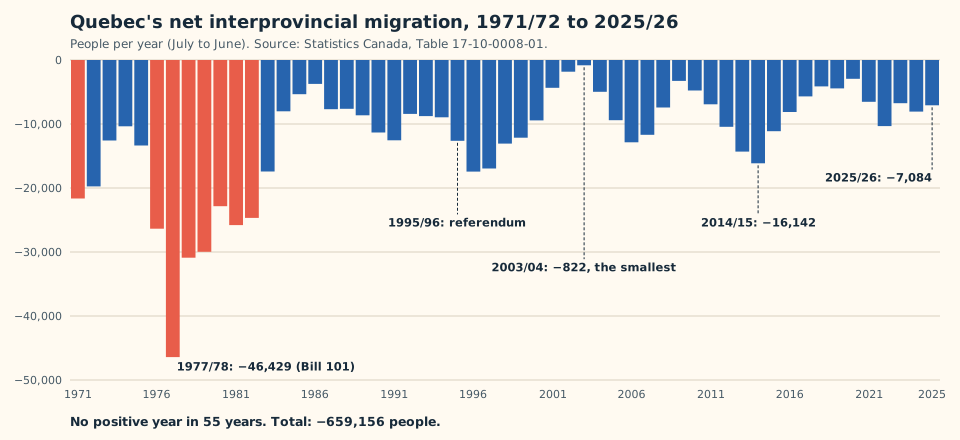
The long-run trend, however, is improvement. The 1970s cost Quebec 234,183 people. Losses were roughly halved in the 1980s and 1990s (about −120,000 per decade), then fell to −61,362 in 2001–2011 before rising to −84,246 in 2011–2021. The latest half-decade (2021–2026) totals −38,754, an average of 7,751 net departures a year, one-sixth of the 1977/78 peak.
| Period | Departures | Arrivals | Net |
|---|---|---|---|
| 1971–1981 | 542,557 | 308,374 | −234,183 |
| 1981–1991 | 371,051 | 250,790 | −120,261 |
| 1991–2001 | 343,191 | 222,841 | −120,350 |
| 2001–2011 | 277,584 | 216,222 | −61,362 |
| 2011–2021 | 282,774 | 198,528 | −84,246 |
| 2021–2026 (5 years) | 169,378 | 130,624 | −38,754 |
| Total 1971–2026 | 1,986,535 | 1,327,379 | −659,156 |
How Quebec compares with the other provinces
In absolute numbers, Quebec is the biggest loser in the record: −659,156 since 1971, ahead of Manitoba (−289,183), Saskatchewan (−269,131), Ontario (−143,228) and Newfoundland and Labrador (−121,636). The two big winners are Alberta (+735,188) and British Columbia (+725,593) [1].
But Quebec is also the second most populous province. Measured against population, the picture changes: over 55 years Quebec lost an average of 1.7 residents per 1,000 a year, far less than Saskatchewan (−4.7), Manitoba (−4.5) or Newfoundland and Labrador (−4.0). Over the last 10 years, Quebec (−0.7) has even done better than Ontario (−0.9) [1] [2].
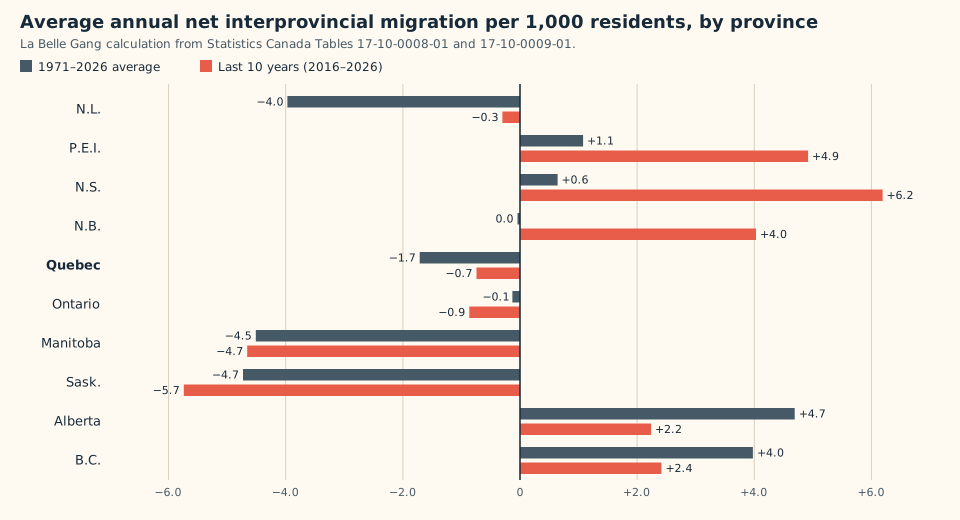
| Province | Cumulative net 1971–2026 | Net 2016–2026 | Out per 1,000 | In per 1,000 |
|---|---|---|---|---|
| Quebec | −659,156 | −64,082 | 3.5 | 2.8 |
| Ontario | −143,228 | −136,821 | 5.6 | 4.7 |
| Manitoba | −289,183 | −64,968 | 13.1 | 8.5 |
| Saskatchewan | −269,131 | −67,145 | 17.2 | 11.5 |
| Newfoundland and Labrador | −121,636 | −1,483 | 12.1 | 11.8 |
| New Brunswick | −917 | +32,471 | 12.7 | 16.7 |
| Prince Edward Island | +8,338 | +7,918 | 20.2 | 25.1 |
| Nova Scotia | +36,361 | +62,695 | 13.2 | 19.4 |
| British Columbia | +725,593 | +123,360 | 8.8 | 11.2 |
| Alberta | +735,188 | +108,813 | 12.5 | 14.7 |
The sharpest change in recent years is not in Quebec but in Ontario. Since 2020/21, Ontario has lost more people than Quebec every year in absolute terms: −42,689 in 2023/24, −29,713 in 2024/25, −18,015 in 2025/26. Over those six years Ontario totals −169,570, against −41,698 for Quebec. Meanwhile Alberta gains (+48,394 in 2023/24) and the Maritimes, long on the losing side, now attract people: +62,695 in 10 years for Nova Scotia, the best rate in the country (+6.2 per 1,000 a year) [1].
The real distinguishing trait: Quebecers barely move
The previous table hides the most important fact in this file. Quebec has the lowest out-migration rate in Canada (3.5 people per 1,000 a year over the last 10 years) and also the lowest in-migration rate (2.8). In Alberta those rates are 12.5 and 14.7; in Saskatchewan, 17.2 and 11.5. Put differently, an Albertan is about three and a half times more likely to leave their province than a Quebecer [1] [2].
So Quebec’s deficit does not come from a mass exodus. It comes mostly from how few people arrive: not many Canadians from other provinces settle in Quebec. In 2025/26, 24,806 people arrived from elsewhere in Canada, against 68,526 in Ontario and 71,496 in Alberta, a province with roughly half Quebec’s population. The most common explanation is language, which works both ways: it keeps a French-speaking majority that would struggle to find a French-language job market elsewhere, and it slows the arrival of English speakers from other provinces.
Demographers have documented this link between language and mobility for decades: for 1976–1981, Marc Termote calculated that Quebec’s English speakers moved to the rest of Canada at a rate 23 times higher than French speakers [7].
Four eras: from the 1970s exodus to Ontario’s reversal
1. The 1970s: the exodus. Quebec was already losing 21,637 people in 1971/72. Losses jumped after the Parti Québécois was elected in November 1976 and Bill 101 was adopted in August 1977: −26,366 in 1976/77, then −46,429 in 1977/78, the worst result on record (70,374 departures, 23,945 arrivals, −7.2 per 1,000). In April 1978, The New York Times described Sun Life moving its head office to Toronto as the symbol of companies leaving Montreal [9] [1]. The data shows a coincidence in time; on its own it cannot assign each departure to a political cause.
It was not just young people. Between 1971 and 1981 every age group lost, including people 65 and over (−15,317), a sign that whole households were leaving [4].
2. 1981 to 2001: smaller but stubborn losses. Losses stayed high in the early 1980s (−25,790 in 1981/82), eased to −3,729 in 1986/87, then rose again in the 1990s. The year of the second referendum, 1995/96, shows −12,626, and the next two were worse (−17,436 in 1996/97, −16,958 in 1997/98). Each decade cost about 120,000 people.
3. The 2000s: near balance, then Alberta’s pull. In 2003/04 Quebec lost only 822 people, its best result in 55 years. The oil boom then changed the picture: in 2006/07, 22.7% of Quebecers leaving the province went to Alberta, against 4.6% in 1971/72 [3]. Losses climbed back to −12,865 that year.
4. 2010 to today: a new peak, then the reversal. Losses climbed to −16,142 in 2014/15, then fell to −2,944 in 2020/21, during the pandemic. Since then they have ranged between −6,500 and −10,300 a year. What is new is elsewhere: Ontario now loses more people than Quebec, and the Atlantic provinces, long places people left, have become destinations.
Language: the key in the 1970s, much less so today
The annual estimates do not say what language migrants speak. For that you need the census, which asks where each person lived five years earlier. Statistics Canada Table 15-10-0034-01 gives Quebec’s balance by mother tongue for every census period since 1971 (people aged 5 and over) [5].
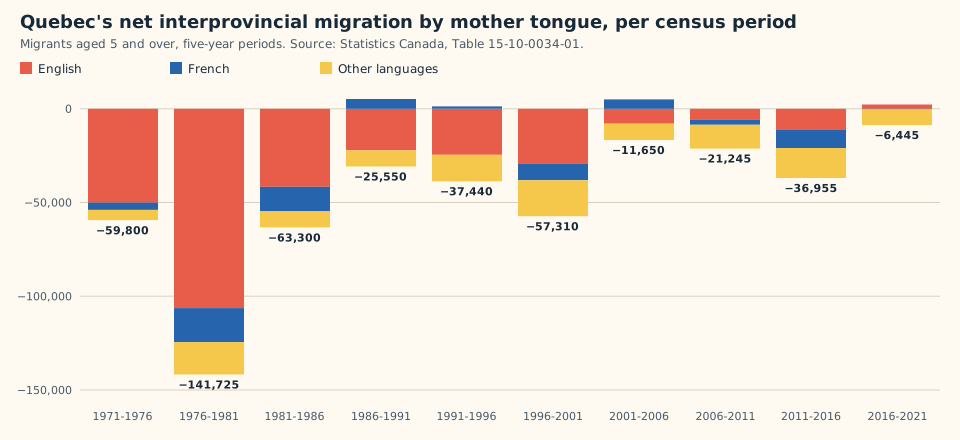
| Period | English | French | Other languages | Total |
|---|---|---|---|---|
| 1971–1976 | −50,070 | −3,900 | −5,460 | −59,800 |
| 1976–1981 | −106,320 | −18,110 | −17,290 | −141,725 |
| 1981–1986 | −41,605 | −12,945 | −8,750 | −63,300 |
| 1986–1991 | −22,195 | +5,225 | −8,580 | −25,550 |
| 1991–1996 | −24,545 | +1,230 | −14,130 | −37,440 |
| 1996–2001 | −29,265 | −8,880 | −19,170 | −57,310 |
| 2001–2006 | −7,970 | +4,995 | −8,675 | −11,650 |
| 2006–2011 | −5,930 | −2,590 | −12,725 | −21,245 |
| 2011–2016 | −11,005 | −9,940 | −16,015 | −36,955 |
| 2016–2021 | +2,288 | −335 | −8,398 | −6,445 |
Three findings stand out. First, the 1970s exodus was mostly English-speaking: in 1976–1981, people with English as their mother tongue account for 106,320 of the 141,725 net departures, or 75%, while they made up about 13% of the population. Their balance equals −142.7 per 1,000 over the period, against −3.5 for French speakers [5]. A QUESCREN working paper (Concordia University) notes that the English-mother-tongue share of the population fell from 13.1% in 1971 to 8.3% in 2001, before rising back to 10.0% in 2021 [8].
Second, French speakers have always moved little: their balance ranges from −18,110 to +5,225 per period, and it was even positive three times (1986–1991, 1991–1996, 2001–2006). Third, the latest census marks a turning point: in 2016–2021, for the first time, the English balance is positive (+2,288; 34,306 arrivals against 32,018 departures). The remaining loss comes mostly from people whose mother tongue is neither French nor English (−8,398), often immigrants who move on to another province.
That last point is shifting too. According to the Institut de la statistique du Québec, recent immigrants admitted as permanent residents now produce interprovincial gains for Quebec, starting with the cohort admitted in 2020 [6].
Who leaves: mostly young adults, and their children
Over the last 10 years (2016/17 to 2025/26), Quebec lost 64,082 people through interprovincial migration. People aged 20 to 44 account for 43,708 of them, or 68%. The two hardest-hit groups are 20 to 24 (−10,370) and 25 to 29 (−10,631): the age of university, the first job and the first move far from family [4].
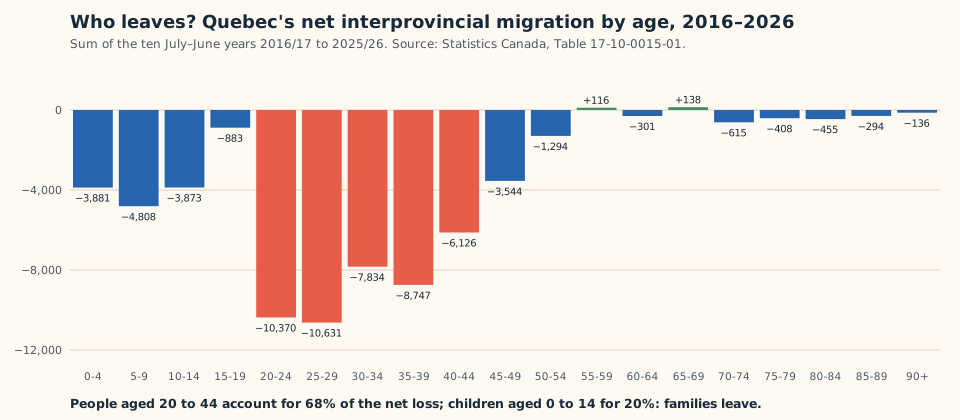
Children aged 0 to 14 account for 12,562 net departures, about 20% of the total: families are leaving, not just students. Between 55 and 69, by contrast, arrivals and departures nearly balance, and the loss among people 65 and over is small (−1,770 in 10 years). Men leave slightly more than women (−34,460 against −29,622) [4].
| Age group | 1971–1981 | 2016–2026 | 2025/26 |
|---|---|---|---|
| 18 to 24 | −46,368 | −10,506 | −1,347 |
| 25 to 44 | −73,385 | −33,338 | −3,591 |
| 45 to 64 | −33,870 | −5,023 | −634 |
| 65 and over | −15,317 | −1,770 | −107 |
| All ages | −234,183 | −64,082 | −7,084 |
Where do they go? Ontario first, by far
Ontario has received most of the Quebecers who left over 55 years: 64% of departures between 1971 and 2026, and 59% in 2025/26. The exchange with Ontario alone accounts for −446,334 people, or 68% of Quebec’s total loss since 1971. Alberta (−94,358) and British Columbia (−82,688) follow far behind [3]. For people making the trip, Montreal–Toronto remains by far the busiest corridor; we break down the cost of a Montreal to Toronto move separately.
| Province | Departures 2025/26 | Arrivals 2025/26 | Net 2025/26 | Net 1971–2026 |
|---|---|---|---|---|
| Ontario | 18,802 | 15,127 | −3,675 | −446,334 |
| Alberta | 3,786 | 2,130 | −1,656 | −94,358 |
| British Columbia | 3,832 | 2,256 | −1,576 | −82,688 |
| Nova Scotia | 1,161 | 735 | −426 | −12,720 |
| New Brunswick | 2,002 | 2,375 | +373 | −10,387 |
| Manitoba | 860 | 704 | −156 | −4,397 |
| Saskatchewan | 497 | 387 | −110 | −3,248 |
| Prince Edward Island | 341 | 588 | +247 | −3,506 |
| Newfoundland and Labrador | 266 | 240 | −26 | +235 |
| Territories (3) | 343 | 264 | −79 | −1,753 |
| Total | 31,890 | 24,806 | −7,084 | −659,156 |
Ontario’s share has changed little in 55 years (68.7% of departures in 1971/72, 59.0% in 2025/26). The big swing came from Alberta, which drew up to 22.7% of leavers in 2006/07 and 19.4% in 1981/82, both oil-boom periods. Today Alberta (11.9%) and British Columbia (12.0%) are neck and neck [3]. New Brunswick is the only province with which Quebec gains noticeably: +373 in 2025/26 per Statistics Canada, and about +900 for calendar 2025 per the ISQ [6]. For longer distances, see the cost of a Montreal to Calgary move.
In perspective: interprovincial migration is small next to immigration
The interprovincial balance is only one component of Quebec’s growth, and today the smallest. Over the last 10 years Quebec received 506,704 permanent immigrants and gained a net 411,300 non-permanent residents (temporary workers, international students, asylum claimants), against an interprovincial loss of 64,082. Natural increase (births minus deaths) added only 80,658 people [1].
| Year | Births minus deaths | Immigrants | Non-permanent residents (net) | Interprovincial (net) |
|---|---|---|---|---|
| 2021/22 | +9,100 | 62,805 | +35,314 | −6,529 |
| 2022/23 | +307 | 64,475 | +103,547 | −10,333 |
| 2023/24 | −1,249 | 55,455 | +123,838 | −6,750 |
| 2024/25 | −2,434 | 57,641 | +28,791 | −8,058 |
| 2025/26 | −1,150 | 53,428 | −21,794 | −7,084 |
Two findings. First, since 2023/24 Quebec has recorded more deaths than births: without migration its population would shrink. Second, the sharp drop in non-permanent residents in 2025/26 (−21,794) weighs three times more than the interprovincial loss. The ISQ estimates that for calendar 2025, Quebec’s total migration balance (international and interprovincial) was negative, at −7,150 people, “for a rare time” [6].
Over the long run, Quebec’s share of Canada’s population fell from 27.9% in 1971 to 21.7% in 2026 [2]. Interprovincial migration contributed, but it is not the only factor: from 1971 to 2026 Quebec received 16.3% of Canada’s immigrants and accounted for 21.5% of the country’s natural increase, well below its starting share [1]. This report does not measure each factor’s exact contribution.
Where things stand in 2026
- Quebec loses about 7,000 to 8,000 residents a year to other provinces: −8,058 in 2024/25, −7,084 in 2025/26 (24,806 arrivals, 31,890 departures) [1].
- That is less than in the mid-2010s (about −14,000 per the ISQ) and far less than in the 1970s [6].
- Ontario now loses more, in numbers and in proportion (−1.11 per 1,000 against −0.78 for Quebec in 2025/26).
- Young adults aged 20 to 29 remain the group that leaves most (−2,804 in 2025/26) [4].
- The 2026 census will show whether the positive English-speaking balance of 2016–2021 holds.
If you are one of those 31,890 departures, you are not alone: our long-distance moving page and moving prices to every other province give concrete figures, and a move for a new job can be tax deductible.
Methodology and data notes
- Annual series: Statistics Canada full tables 17-10-0008-01 (components), 17-10-0009-01 (July 1 population), 17-10-0015-01 (age and gender) and 17-10-0022-01 (origin and destination), downloaded October 15, 2026. Years run July 1 to June 30; the latest two years are preliminary estimates that get revised [1] [2] [3] [4].
- Rates per 1,000: the year’s net (or departures, or arrivals) divided by the province’s population on July 1 at the start of the year, then a simple average of the years in the period. La Belle Gang calculation.
- Language: census data (and the 2011 National Household Survey), migrants aged 5 and over, by province of residence five years earlier. These figures do not add up to the annual series: they leave out children under 5, deaths during the period and round trips [5].
- The ISQ publishes calendar-year figures (January to December), which differ from Statistics Canada’s July-to-June figures and are often revised: −7,600 for 2025 in the May 2026 demographic report [6]. This report uses the Statistics Canada July–June series throughout unless stated otherwise.
- Links between political events and departures are presented as timing documented by the press and researchers, not as measured causes.
Cite this report: La Belle Gang, “Leaving Quebec: 55 years of interprovincial migration, by the numbers (1971–2026),” labellegang.ca, October 15, 2026. Data from Statistics Canada; free to reproduce with attribution.
Frequently asked questions
How many people leave Quebec for another province each year?
In 2025/26, 31,890 people left Quebec for another province or territory and 24,806 arrived, a net of −7,084. Departures have ranged from about 24,000 to 37,000 a year since 2010.
Has Quebec ever gained residents from the other provinces?
No, not a single year since the series began in 1971/72. It is the only province in that situation. The year closest to balance was 2003/04 (−822).
Where do people who leave Quebec go?
Mostly to Ontario: 59% of departures in 2025/26 and 64% since 1971. Next come British Columbia (12.0%) and Alberta (11.9%), then New Brunswick (6.3%).
Does Quebec lose more people than Ontario?
Not since 2020. From 2020/21 to 2025/26, Ontario lost 169,570 people through interprovincial migration, against 41,698 for Quebec. In 2025/26 the rate was −1.11 per 1,000 in Ontario and −0.78 in Quebec.
What was the worst year for departures from Quebec?
1977/78, with 70,374 departures, 23,945 arrivals and a net of −46,429, the year after the Parti Québécois was elected and the year Bill 101 was adopted.
Are English speakers still leaving Quebec?
Far less than before. In the 2021 census, for 2016–2021, the balance for people with English as their mother tongue was positive for the first time since 1971: +2,288. In 1976–1981 it was −106,320.
How old are the people leaving Quebec?
Mostly between 20 and 44, or 68% of the net loss over the last 10 years. People aged 20 to 29 leave in the largest numbers. Children aged 0 to 14 make up about 20% of the loss, a sign that families leave too.
Why does Quebec lose residents if its population is growing?
Because international immigration more than makes up for it. Over 10 years, 506,704 permanent immigrants and a net 411,300 non-permanent residents arrived, against an interprovincial loss of 64,082.
An informational report based on public data. Recent Statistics Canada and ISQ estimates are preliminary and may be revised. Mentions of political events describe a timeline, not a position.
Sources
Figures come from Statistics Canada full tables (downloaded October 15, 2026), the ISQ and the work cited below. Rates and totals are La Belle Gang calculations.
- Table 17-10-0008-01: Estimates of the components of demographic growth, annual — Statistics Canada
- Table 17-10-0009-01: Population estimates, quarterly — Statistics Canada
- Table 17-10-0022-01: Estimates of interprovincial migrants by province or territory of origin and destination, annual — Statistics Canada
- Table 17-10-0015-01: Estimates of the components of interprovincial migration, by age and gender, annual — Statistics Canada
- Table 15-10-0034-01: Interprovincial migration by mother tongue, migrants aged 5 years and over, 1971 to 2021 — Statistics Canada
- International and interprovincial migration: highlights of the Bilan démographique du Québec, 2026 edition (French) — Institut de la statistique du Québec
- Marc Termote, “Le comportement démographique des groupes linguistiques au Québec pendant la période 1976-1981: une analyse multirégionale,” Cahiers québécois de démographie, vol. 14, no. 1, 1985 (French) — Érudit
- Simon-Pierre Lacasse and Meghan Rulli, Understanding Youth Out-Migration Among English-Speaking Quebecers: A Literature Review, Working Paper no. 17, September 2026 — QUESCREN, Concordia University
- “Quebec’s Language Law Puts Companies to Flight,” April 23, 1978 — The New York Times
Read next
La Belle Gang
Part of the statistics?
Moving to Ontario, Alberta or anywhere in Canada: a dedicated truck, the same crew from loading to delivery, and a written price before we load.
